Table of contents
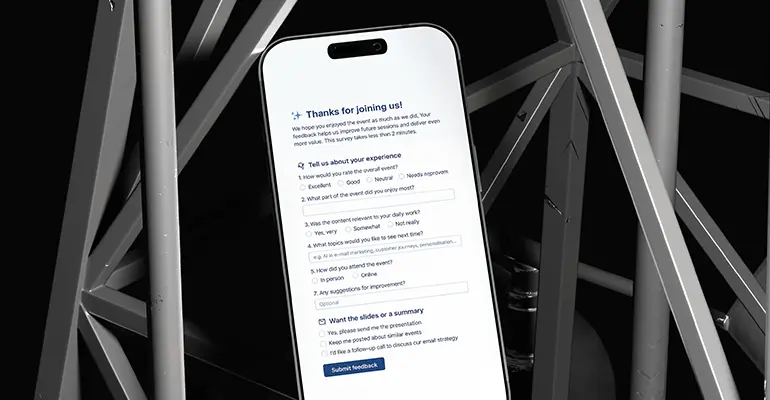
How to conduct the perfect post‑event survey
A survey is a powerful tool to measure your event goals. Conducting a survey is not easy. It takes marketing skills to choose the right questions, communication skills to convince your attendees to complete it and organisational skills to use the data for your next steps. And yet, the response to your post-event survey can be a real treasure! In this guide, we’re diving into creating and analysing post-event surveys, with practical tips you can use for future events.
The bigger picture: Setting & measuring your goals
Every event manager wants to get the most out of their event. You need the right target group, with the right message, at the right time to achieve that. But let’s take one step back. Why is the event organised? What is the objective of the event? For many organisations, events are part of a bigger marketing strategy. The event should always support that strategy, and tangible results are important. There are several marketing metrics to measure these objectives:
Return On Investment (ROI)
Return on Investment looks at the balance between costs and benefits. In the case of events, calculating the ROI is not easy: the return is difficult to measure. It might take a few weeks or even months before there is a return. And even then, it is hard to say whether the event was the reason. Besides, many events indirectly contribute to the marketing strategy, eg, positioning the brand as a Quality Brand, or ‘Engaging the community’. Companies often measure the costs per attendee to see whether an event is worth the investment.
Net Promotor Score (NPS)
The Net Promoter Score is one of the most powerful indicators. It shows the overall enthusiasm of your audience and identifies your biggest promoters or critics.
Customer Lifetime Value (CLV)
The Customer Lifetime Value is interesting for companies to see what the current value of a client is, considering the profit over a lifetime duration. In other words, what revenue can they realise? Measuring the CLV for an event might show whether clients who attend events have a higher CLV than clients who do not visit events.
But how do you gather the information you need? A post-event survey is the ultimate tool to evaluate your event. Did the message come across? How willing are the attendees to promote the event/brand to their network? How did they rate the individual elements of the event? The feedback of the attendees will tell you what you need to know. However, setting up a good survey requires preparation and time.
Easily create post-event surveys with Spotler. Learn more »
Get started: Set up a post-event survey in 5 steps
Before assembling the questions, take a minute and turn away from your computer. Imagine a survey as a game between you and your attendees. The goal is to collect as much valuable data as possible with as few questions as possible. The longer a survey is, the higher the probability that your attendee will not complete (or even start!) it. Aim for 100% completion and at least 75% of post-event survey results. You can win this game by following the K.I.S.S. approach: Keep It Simple Stupid. To yourself AND your respondents.
These five steps will help you create a solid post-event survey:
- Determine the objective of the survey
- Decide what you will do with the answers
- Consider what your answers should look like in the export
- Choose the type of questions carefully
- Encourage respondents to complete the survey
Step 1. Determine the objective of the survey
Ask and answer for yourself: Why am I conducting this survey? Once you’ve determined the objective, the rest will follow easily. All questions need to support this goal. Numerous possible objectives, such as measuring marketing goals, collecting feedback about the event, and even just listening to your attendees, can be reasons for conducting a post-event survey.
The objectives can differ for each event.
Step 2. Decide what you will do with the answers
What will you do with the response you receive? Will you take action? Or is it just nice to know? It is not advisable to survey ‘nice-to-know’ information. Only ‘need-to-know’ information is recommended. You are asking your attendees for a favour; it takes time to complete a survey. Ensure you have a good reason to conduct a survey and use the answers to improve your next event. If the answers will disappear into an archive, save yourself and your attendees the time and don’t do it!
Step 3. Consider what your answers should look like in the export
When your results are complete, you will analyse the answers. You can only do this when the export gives you the information in the right format. It would be a shame if the data results are complicated or useless for your analysis. Decide for yourself how you would like to analyse the answers. Figuring this out before conducting the post-event survey will save you time recoding the answers.
Step 4. Choose the type of questions carefully
You know your objectives and desired outcome, and have figured out what your data should look like. Finally, it’s time to build the post-event survey! There are various types of survey questions:
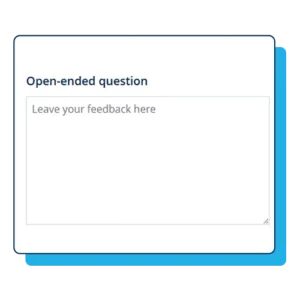
- Open-ended questions (What did you think of the keynote speaker?)
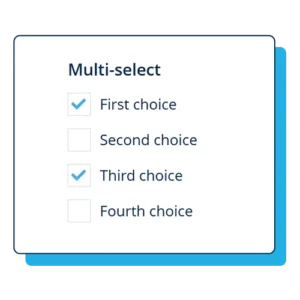
- Multiple choice questions (What sub-session did you visit?)
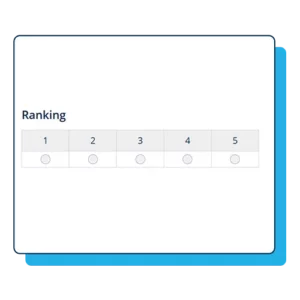
- Rating scales:
» NPS (How likely is it that you would recommend this event to a friend or colleague? 0-10)
» Likert scale (This event has met my expectations (I strongly agree <> I strongly disagree)
» Stars (How would you rate the event? 1 – 5 stars)
Step 5. Encourage respondents to complete the survey
Since you’ve put a lot of time and effort into making the post-event survey, your respondents must complete it. The first step is to invite your respondents to participate with a clear email. Remember: you’re asking them to help you with their feedback. Be grateful and honest at all times. Explain in a short email why you need their input and what you will do with the answers. Inform them about the duration, number of questions and anonymity of the survey.
Tips & Tricks
- Start with an easy question to warm up your respondents.
- Ask the most important questions first.
- K.I.S.S.: Keep It Simple Stupid (Easy questions, easy answers)
- End with a field for suggestions.
- Use a start and finish page to navigate them through the post-event survey.
Use the post-event survey as an instrument to measure your event objective. Try to minimise the number of questions and only aim for ‘need-to-know’ information. Choose your questions wisely and build your survey smartly to obtain maximum results.
Psychology: Do’s and Don’ts
After creating your first draft of the questionnaire and deciding what your export will look like, the next step is to look at the psychological effect. After all, you want to work with ‘pure’ data in your analysis. The choice of words and questions can significantly impact your data. To avoid pitfalls be consistent, check these do’s and dont’s.
Dos for post-event surveys
Be neutral in your questions
The selection of words, nouns, and adjectives affects the attendee’s answer. “How good did you think the speaker was?” suggests that the speaker was good. A better alternative would be: “What did you think of the speaker?”
Be careful with ‘priming’
Priming means that an answer to a question can affect another answer in your post-event survey. For example, when the attendee answers a question about a negative experience at the event, it can affect the answer to another question related to the event experience. To avoid priming, pay close attention to the order of the questions.
Cluster questions as much as possible
Sometimes, you want to gather more information about the same topic. Combining the answers can give you more insights if you choose them wisely (1+1=3). But remember the K.I.S.S. rule: fewer questions = more completed surveys.
Don’ts for post-event surveys
Double questions
Clustering does not mean you can ask two different things in one question. For example: “What did you think of the speaker and the theme of the event?” The attendees can only answer one question, so you cannot determine whether they liked the speaker, the theme, or both! Therefore, this question should be split up into two separate questions.
Negative questions
You force your attendee to think the opposite when you ask a negative question. For example, “I will not attend this event again next year.” What would “YES” mean? Remember, we mentioned K.I.S.S.? Simple, in this case, means always asking in a present, positive form.
Variation in Likert scales
Always use the same order in your answers when asking multiple Likert questions.
E.g. always choose:
I strongly agree | I agree | Neutral | I disagree | I strongly disagreeYour attendee needs to think about the correct answer; do not ask them to think about the navigation too. The way you formulate a question is bound to influence the results. You aim to collect data that is as ‘pure’ as possible. To achieve this, stay as neutral as possible and keep it simple for you and your attendees.
Analyse: Unfold the true story of your attendees
The results of your post-event survey will tell the story of your attendees. A good analysis will help you understand their experience and measure your goals. Here’s how to analyse the main question types: open-ended, multiple-choice, and scaled questions.
Prepare your data
The data from a survey can be analysed using your online survey tool. Most tools visualise the results in charts and tables. Exporting them to Excel will enable you to make a more in-depth analysis. Before you can analyse, you need to prepare the data:
Missing values
Unfortunately, not all respondents finish the survey. Look for empty fields in your dataset. If a respondent gave very few answers, delete it. If the most important questions are answered, include the respondent in your analysis. This decision is subjective and differs from case to case.
Recoding
Your answers will also be exported as text when using the Likert scale. Transform these answers to numbers: I strongly agree = 5 / I strongly disagree = 1. TIP: Use the ‘replace all’ function (CTRL+F – or COMMAND+F for Mac users).
Grouping
Some answers can be grouped – for example, per workshop session. Collect those answers to focus on a specific topic or compare them with other groups. When the data is prepared, you are ready to run your analysis. Every type of question has different reporting options.
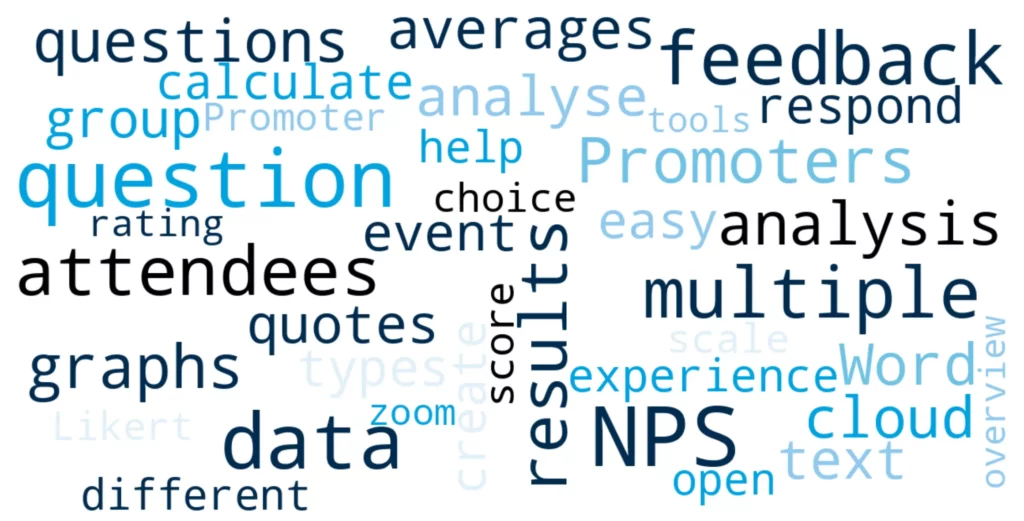
Open-ended question
This type of question results in a big variety of answers. Open questions can lead to surprising results that can benefit your organisation. However, they are more challenging to analyse. There are multiple ways to structure the output:
Word Cloud
Word clouds give greater prominence to words that appear more frequently in the source text. How to create a word cloud? Just add ‘create word cloud’ to Google. The rest will follow.
Individual quotes
Some quotes represent a larger group. Categorise the positive and negative quotes to show your attendees’ feedback.
Cluster themes
When you see multiple answers referring to the same theme, cluster them into a group. You might see some interesting trends appear.
Multiple choice questions
This type of question has fixed answers. It is easy to analyse and can quickly be visualised with graphs, tables, and charts. Charts can present the data in one overview. A frequency chart is often used to overview the results quickly.
Rating questions
Rating questions are easy to read when they are visualised in charts. You will see the popularity and averages of the answers. Most post-event survey tools create charts for you. If not, you can use Excel.
- Likert scale: recode the export to calculate the averages (see ‘prepare your data’)
- Rating: shows what’s most/least popular and averages
Net Promoter Score
Last but not least, one of the most powerful indicators is the Net Promoter Score (NPS). This score indicates which attendees are your biggest promoters or critics.
You can calculate your NPS using a single question, with a 0-10 scale: How likely would you recommend the event to a friend or colleague? The answers can be divided into three categories:
- Promoters are those who respond with a score of 9 or 10 and are considered loyal enthusiasts
- Scores of 7 and 8 are passives and are considered to be neutral
- Detractors are unhappy customers: those who respond with a score of 0 to 6
Calculating the NPS is easy: Subtract the percentage of Detractors from the percentage of Promoters.
NPS = % Promotors -/- % Detractors
The NPS score can range from -100 (100% Detractors) to + 100 (100% Promoters). The answer indicates the overall enthusiasm of your audience. When you zoom in on the NPS score per person, you might find out the aspects that affected the experience. Maybe one detail of the event was of great influence (e.g. no parking space, long waiting lines, great F&B). Try to listen to the story of your attendee by reading the feedback. It takes some effort, but it can lead to interesting insights!
Post-event surveys change the way you host events
The response to your survey can be a real treasure; however, interpreting and analysing the information is key. Collect, group, and rearrange the information to reveal the main conclusions. Then, read the individual feedback to unfold the true story of your attendees.
As you can see, post-event surveys are a truly powerful tool when conducted and analysed correctly. Your attendees hold valuable information, and understanding this will help you achieve your goals and create even more impactful events in the future!
Want to learn more about hosting the perfect B2B event and sending out post-event surveys? Sign up for a demo of our event management platform!
Keep expanding your knowledge
10 tips to make your event as chaotic as possible
Slick, professional events are over-rated! Follow these tips to cause yourself maximum stress and get the least possible value back.
How to realise flawless event registration
Flawless registration is an important element of your event; your attendees’ experience starts here!
Hosting a B2B event? Here’s how to sell it out
We're outlining how the right ticketing strategy can elevate your event quality and help you sell out faster.
How to lower no-show rates at your events (Live & Online)
No-shows drain resources and energy from your events. Discover 4 proven strategies to lower no-show rates at live and online events.
5 event management tips to make your event unforgettable (and less stressful)
5 practical event tips to boost engagement, reduce no-shows, and make your events unforgettable.
How to make your B2B event website come alive
Your B2B event website is not just a digital flyer or a "nice to have" on a checklist. It's where your event begin, so you have to get it right.
How to create compelling emails for your B2B event
Learn the ins and outs about event mailings, backed by tens of thousands of events hosted by our customers.
3, 2, 1… Action! Your last-minute livestream checklist
During the preparation of your live stream, you have a lot to manage. To help you keep a good overview, we created this quick checklist.
Eight tips to increase the attendance rate of open days
Colleges and schools compete for attention with open days. Discover 8 tips from Spotler to boost attendance and attract more students.
How to set up an online event registration flow
Tired of juggling messy Excel lists for event sign-ups? Learn how to set up a smooth online registration flow in 5 steps.