
Does the idea of campaign reporting fill you with despair? Does it mean a flurry of Excel spreadsheets as you piece together a picture of how your customers move through their journey click by click, touchpoint by touchpoint?
Well, despair no longer! You can now use Spotler Analytics to do all the heavy data lifting for you.
Prefer to watch instead of reading? Watch our webinar now.
View all your usual stats in context
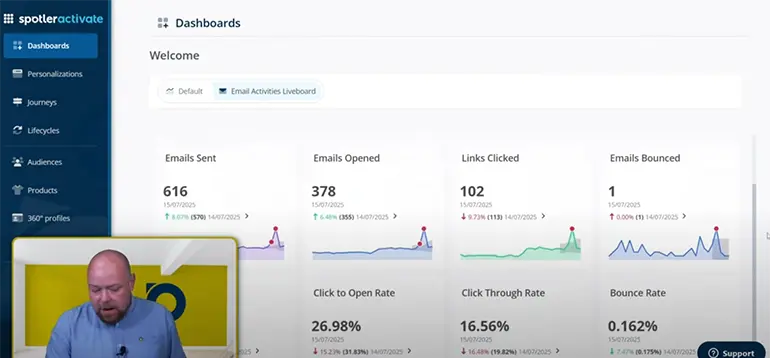
You’re used to looking at Opens, Clicks, Bounces and CTR. All those stats are still in Analytics, included in the default Liveboard.
What Analytics does better is give you a clearer overview. No more jumping between tabs or Excel sheets to compare campaigns one at a time! If there’s been a spike or a dive in your key metrics, you see it. If one campaign bombs while everything else is doing fine, you’ll have that context to avoid a panic.
You can view the data that feeds each graph as a table view to understand what’s going on.
Follow the Money
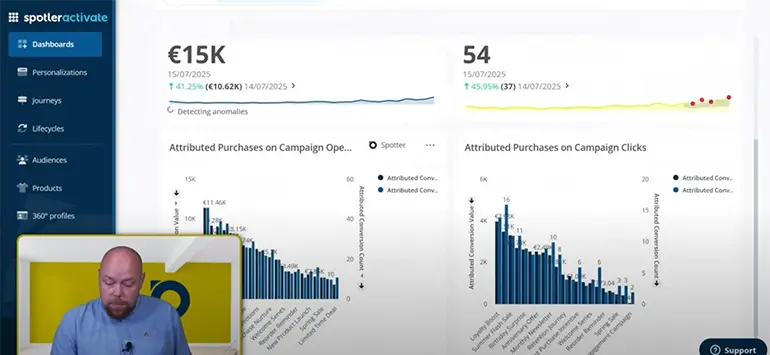
One thing we still hear far too often is that marketers don’t effectively explain the link between activity measures like Opens and Clicks, and actual Revenue. Well, those days are over!
You’ll still need to define the time period for attribution, from 1 to 28 days, but once you’ve done that Analytics will show you the revenue value of every campaign in your specified date range.
It’s worth noting that 28-day attribution is the standard for “Email Influence” in Google Analytics, so it’s probably best to start there if you’re used to GA.
Chat with your data
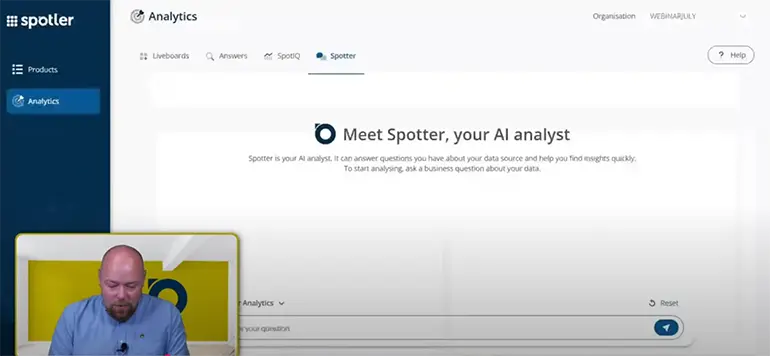
Research by Ascend2 suggests that only 13% of marketers have no plans to use AI this year. So, I’m going to guess that you’ve had a conversation with ChatGPT, Gemini or something similar.
If so, then you’ll understand how Spotter works immediately. Write your query in natural language (i.e. “Which campaign had the highest bounce rate in Q1?”) and Spotter will translate that into the parameters it needs to get you an answer.
Just like other AI models, Spotter works with continuous conversations. So, you could follow up your Bounce Rate question by simply typing “How does this compare to Q1 last year?” and the AI will expand on your initial query.
Unlike ChatGPT or Gemini, Spotter does not hallucinate. This is because it is trained solely on your data, and does not draw from the wider internet when answering questions. Spotter is its own platform, rather than a custom GPT; the interface looks like ChatGPT for familiarity and ease of use, but the reporting AI that powers it is actually nearly a decade older than Generative AI!
Data deep dives
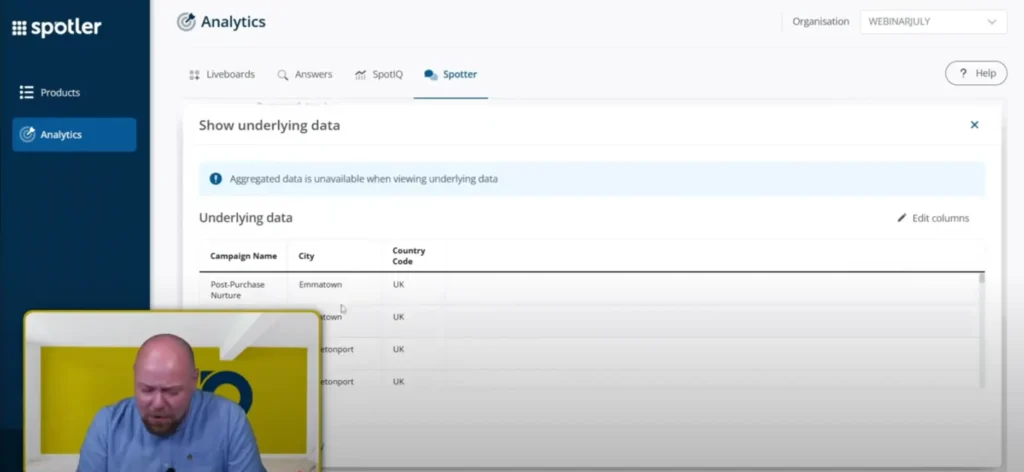
So, one of your campaigns is performing as well as a snail in a 100m sprint race. Why?
Spotter allows you to deep-dive into any campaign, with 106 values, like country code, click day or conversion value.
Maybe the campaign that did poorly overall was a hit for one specific group. Or it did middlingly well for most of your audience, but went down very badly indeed with a chunk of your audience. This is what we mean when we say that we’re making it easier to fully understand your data.
Change analysis
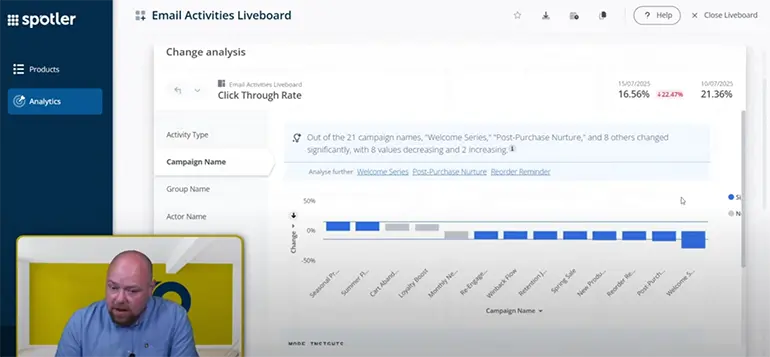
What’s causing the changes you can see on your Liveboard? Find out with Change Analysis.
Whereas deep dives let you see one campaign in granular detail, Change Analysis is about multiple campaigns over time. If all your campaigns are seeing fewer Clicks, that’s a different issue to one single campaign’s performance collapsing while the others chug merrily along.
Stay on top with Alerts
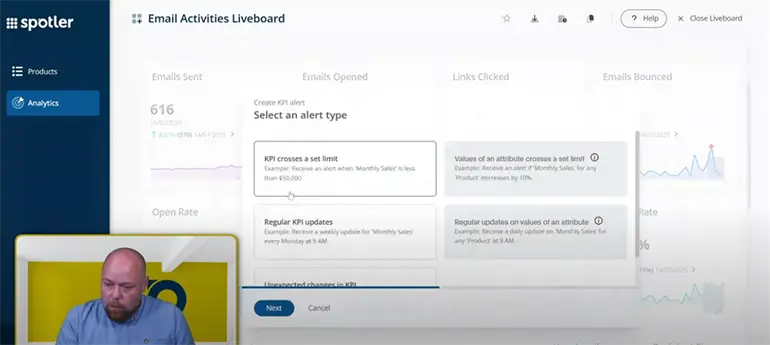
There’s always a risk of drowning in data; you can see so much that it becomes overwhelming. That’s where Alerts come in.
You can set Alerts for various scenarios; if a KPI hits a specific threshold or if there’s an unexpected change (with you in control of what counts as ‘unexpected’) or simply a regular report on your most important handful of numbers.
Alerts aren’t just for warnings; you could get notified when your Q3 revenue hits the target you’ve budgeted.
Share your success
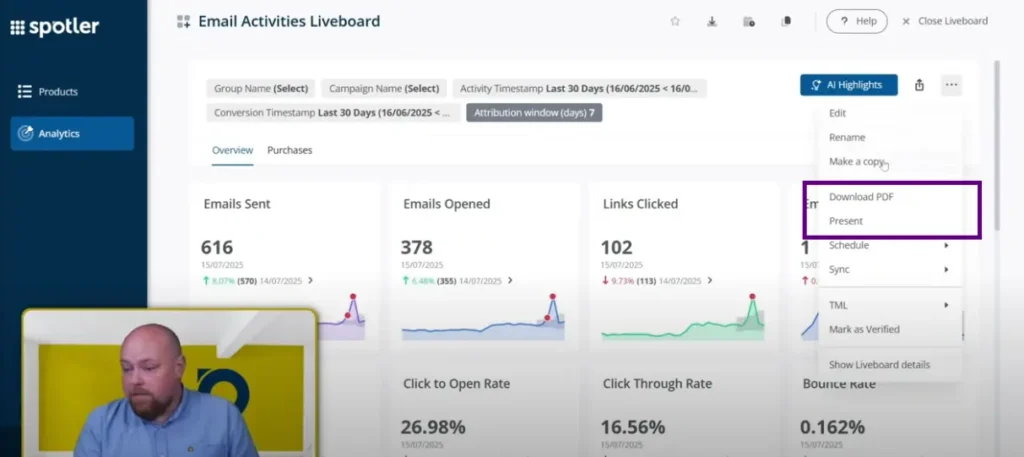
Analytics doesn’t just help you understand your data, it helps you explain the impact of what you’re doing to everyone in the business.
Whether it’s a weekly check-in with your Sales team, or a big annual presentation to senior management, it’s simple to export your Liveboard data as a PDF, or present it directly in your platform of choice.
What if the measure I want isn’t there?
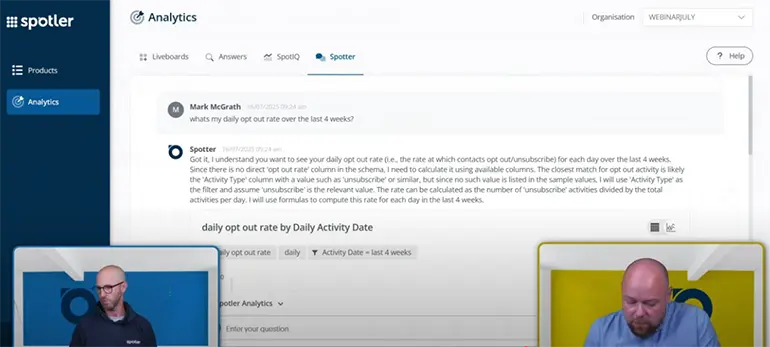
You can absolutely ask Spotler Analytics for a metric that doesn’t exactly match any of its parameters. In that case, it will interpret your request as best it can, and it will explain what it is doing.
In the example above “Opt-out rate” isn’t a metric, but the AI can understand that “unsubscribe” is an accurate equivalent, and present that data in its answer. By showing its reasoning, if the result wasn’t what you were expecting you’ll know how to tailor your reply with extra guidance.
Conclusion
Spotler Analytics gives you a new level of insight into your data. You’ll see clearly how your audience is responding to your efforts, both in the short term with Opens and Clicks, and longer term with revenue attribution.
Want to get started with Spotler Analytics?
If you’re already using Activate and Mail+ or MailPro, speak to your Account Manager to get started.
Not there yet? See what Activate can do for your business.