What if you could just ask your data a question and get an immediate answer?
Not through a report at the end of the week. Not via a dashboard full of filters, tabs, and uncertainties. But in plain words, like you would ask a colleague.
- Which campaign brought in the most revenue last month?
- What changed in our revenue last week?
- Any idea why revenue spiked on Friday?
- What’s the click-through rate trend this month?
More and more marketers want to understand what is happening, not just report what already happened. But most tools still get in the way.
Let your AI marketing dashboard answer your questions
Today, marketing teams often work with the following setups:
- Standalone dashboards in tools like a CRM system, CDP (Customer Data Platform), or email marketing software. Each with its own logic and data sets.
- Excel exports that are combined in pivot tables, hoping to identify by Wednesday what went wrong on Monday.
The result? Blind spots. Conflicting KPIs. Campaigns based on assumptions. Your data is whispering from all directions. You’re shouting for clarity.
And when you finally spot a pattern? You have to wait for the BI team. Or for that one colleague with odd access rights. That has to change.
Why AI Analytics is needed
Marketing is changing faster than most organisations can keep up with. By 2025, 75% of marketing teams will use AI tools. But only a fraction have real-time access to reliable insights.
The pressure to perform is increasing. Customers expect personalisation. Finance demands justification. And marketing needs to act in the moment.
The tools are available, but they rarely speak the language of marketers. What’s needed? Technology that works without BI projects, without waiting times. Just: a question. An answer.
One timeline. One search bar. One truth.
Spotler Analytics is not an extra dashboard. It’s a central live interface that brings together data from Activate CDP, Mail+, and MailPro.
You ask a question about your campaign, your conversions, or anything else you want to understand as a marketer. You get an answer. Including graphs, segments, and AI insights you hadn’t even considered.
No exports, no waiting, no code. Just your curiosity. What used to take hours of Excel-fiddling now takes five seconds. No BI team, no delay, with results.

How does Spotler Analytics work?
Spotler Analytics consists of four components that ensure you get answers to questions about your campaign performance.
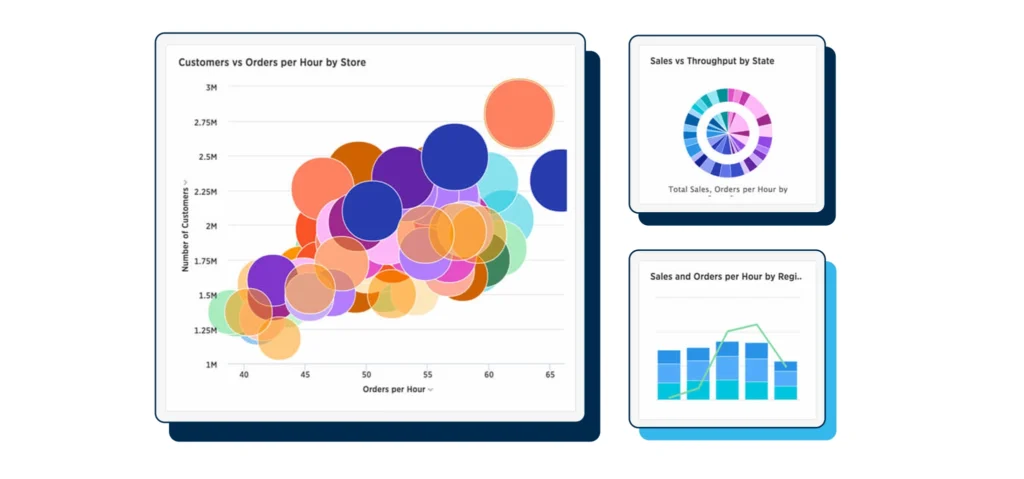
Liveboards: always up-to-date overview
A Liveboard is a dynamic, interactive space where you can see live insights from email campaigns and CDP data, all in one place.
You no longer need to build dashboards or merge exports. A Liveboard refreshes itself automatically. It’s not just a reporting tool, but a workspace where you can immediately zoom in on anomalies, click through to details, and share insights with your team.
Visuals are intuitive and click through logically, from channel to campaign, from segment to product level. The interface is designed for curiosity, whether you’re a marketer or CRM specialist.
Do you see that? A dip in returning customers, while the newsletter had 8% more clicks. Time to dig in.
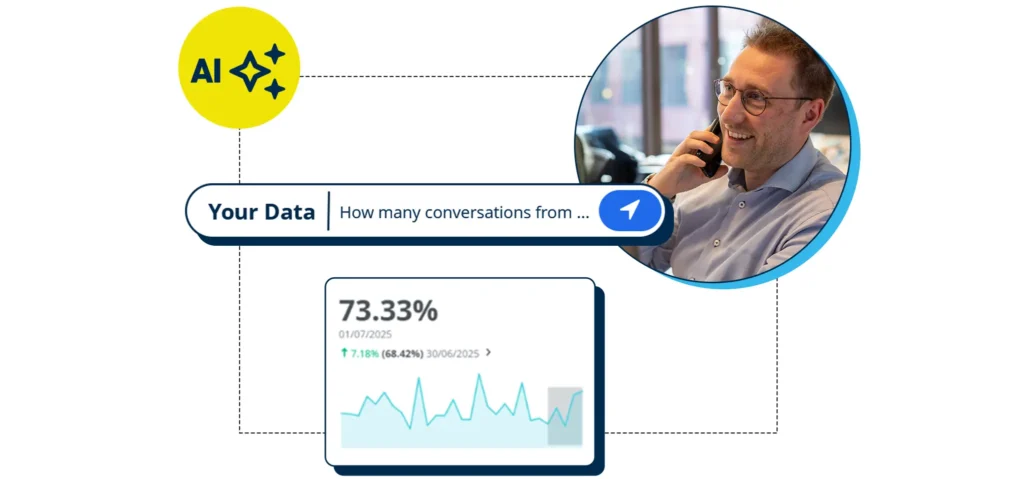
Spotter: your AI analyst in a single search bar
Imagine not having to click through filters or speak BI jargon. You type a question like “Which channels generate the highest ROI per customer segment?” and Spotler Analytics immediately shows the answer in a clear visual. That’s Spotter, an AI-driven assistant that searches the way you speak.
1. Start simple
Spotter gives suggestions based on your data. One click and you’ll instantly see a trend analysis of campaigns or revenue.
2. Drill down with follow-up questions
Ask, “What about mobile?” Spotter keeps the context and refines the data for you.
3. Go to column-level insights
Want specific insights? Spotter switches easily from natural language to technical detail, but keeps it understandable. No code, just smart interpretation.
4. Share and continue
Save your visual, share it with your team, or ask the next question. Spotter remembers the context.
Trust and learning
Spotter learns with your data. Every question you ask improves its understanding, so it becomes better tuned to your business. That makes self-service not only easy, but reliable. AI that understands you, not surprises you.
SpotIQ: patterns you hadn’t seen yet
SpotIQ is the automatic exploration engine within Spotler Analytics. It continuously analyses your data for trends, spikes, and anomalies, without you having to ask.
You can think of SpotIQ as a digital colleague who independently forms hypotheses, checks results, and alerts you to notable changes. It helps you make faster decisions by uncovering insights that would otherwise remain hidden.
Whether you’ve just launched a new campaign or want to see the effect of a pricing change, SpotIQ immediately shows you what’s changed, when, and for whom. You don’t have to look for correlations. SpotIQ does the work. You assess the impact.
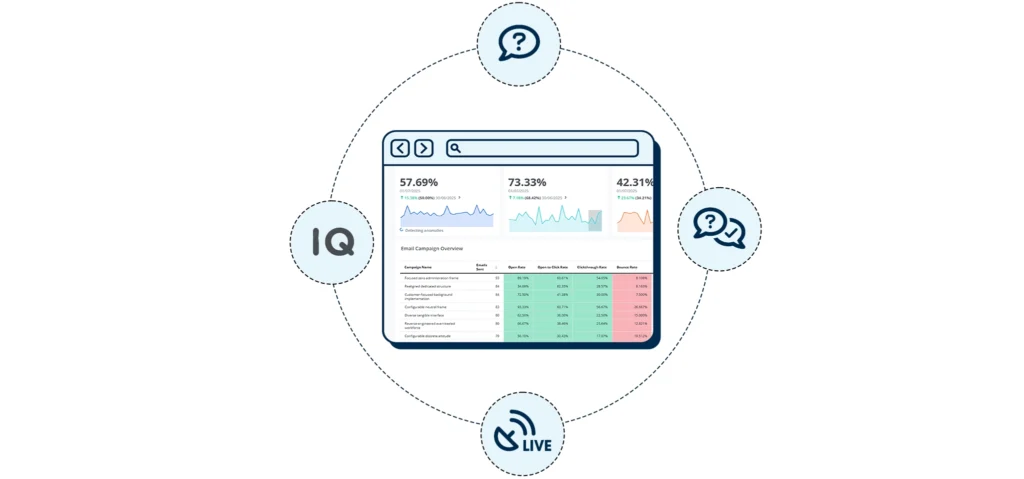
Answers: guided towards deeper insights
Answers is more than a response module. It’s your analytical navigator within Spotler Analytics. A single place where you come up with questions, store insights, and share them—without BI or complex tools.
Save search results as an Answer
Every visual that comes from your question can be saved and added to your Liveboards. This way, you build a personal library of valuable insights.
Build on previous work
Thanks to version control, you can view, adjust, and reuse old Answers. Every follow-up analysis starts from an existing insight.
Explore with structure and speed
Think of: “How is our abandoned cart flow performing per segment this quarter?” Spotler helps you step by step with filters, comparisons, and drill-down options, without overwhelming you.
Share effortlessly with your team
Share insights with anyone, including the context such as filters and visual style. What you visualise can be immediately used by colleagues.
With one click, you repeat analysis. With one click, you share insights. Answers makes analysis feel natural.
In practice: from hypothesis to adjustment in real time
Imagine a small marketing team at a wellness webshop. On Monday morning they start with three dashboards, five tabs, and an Excel sheet that’s already two days old.
By Wednesday, the report is finished. By Thursday, the campaign is over. With Spotler Analytics, they ask their question on Monday morning: “What is the effect of our email campaign on repeat purchases in the loyal customer segment?”
They see real-time margin, segments, and conversion. And adjust the campaign before lunch. Finance orders stock. Marketing doubles the budget. Customer service receives fewer questions. What used to take days now happens in an hour.
Five insights for modern marketers
- You don’t need to be a data nerd to ask a good question.
- Real-time insights are not a luxury. They are essential for growth.
- AI doesn’t work for you, it works with you—if used wisely.
- The ability to act independently equals a strategic edge.
- Every stand-up starts with a question. Now there’s an answer too.
Curiosity is the best strategy
Good marketers are curious. They want to know what works, what doesn’t, and why. But often, finding the right answer is difficult: slow, unclear, or lacking a clear cause-effect relationship. Spotler Analytics provides immediate clarity. In plain language, without detours. That way, curiosity isn’t an obstacle but a driver. For sharper decisions, faster action, and better results. Insight starts with a question. So keep asking. Stay curious.
Interested how AI analytics work? Get a demo now
Do you want to see how you easy AI analytics really is? We are eager to show you. Request a demo now and discover what it can offer you.
